Arrow-Tip #61 Publishing KPI Metrics in Microsoft Excel
In Arrow-Tip #56 and #57 Creating Metrics to Illustrate KPIs Parts I and II, we discussed the metrics that my client Gulf Coast Welding (GCW) Corp. decided to track. After some agonizing over where to house the data (to be discussed in the next Arrow-Tip) we decided it was easiest to compile the data in a Microsoft Excel workbook and then publish it to SharePoint from there. So here is how we set up the Excel workbook:
Worksheets / Tabs
![]() (click image to expand)
(click image to expand)
We set the first tab (see thumbnail above) up as our “Company Dashboard” tab where metrics are summarized in a table and graphically in a bar chart. We were then able to publish that first worksheet as a single file web page (.mht) (see: How to Create a Web Page from an Excel Worksheet) which can be referenced in a SharePoint web part (see: How to Reference a Web Page in a SharePoint Web Part) and then displayed on our Team Website Home Page.
Subsequent worksheets were set up for each of the seven metrics that we are tracking. For some metrics where data is coming from GCW’s Unix based accounting system (that will not talk with Microsoft Applications like Excel) we input data directly into the spreadsheet. In other cases where data used to produce the metrics is housed in another spreadsheet, we use links within Excel to reference that data. We’ll discuss those links in more detail in the next Arrow-Tip.
Dashboard Metrics Table
(click image to enlarge)
For each metric we took a look at what our numbers looked like at the time we started tracking and set a goal for improvement. Goal units of measure matched those for the metric such as dollars for Average Cost per Hour and Annual Pipeline Value and percentage values for On Time Shipment, etc. We wanted a quick visual way to get a feel for how close we wer to meeting each goal so we decided to calculate percentage of goal for that visual. In some cases, the idea was to get the value of the metric reduced in order to meet the goal such as weith Average Cost per Hour son in that case the formula for % of Goal is =C20/B20. In the case of Annual Pipeline Value we wanted to raise the metric value to the goal value so the formula is =B30/C30.
Since we did not have historical data for all the metrics we were tracking and we wanted to base most of them on a one year rolling average, we also track “As of Date” which reflects the first date for which we began tracking data. Last Updated is the date that the values were last updated which is important since some of the metrics get updated monthly versus daily for others.
Dashboard Metrics Chart
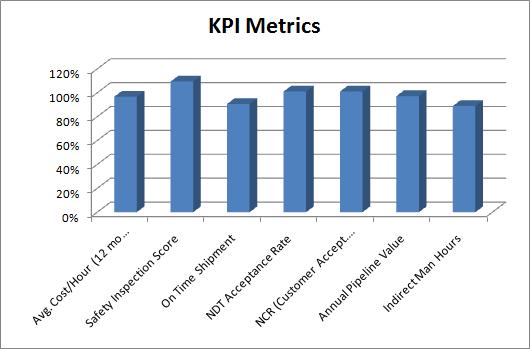
Percentages are great, but many of us absorb graphical data a little more quickly so we also created a simple bar chart to illustrate Percent of Goal for each metric (values shown are for illustration only and not actual GCW Corp data which is proprietary). Both the table and chart reside on the Dashboard worksheet and are reproduced in the aforementioned SharePoint web part which is the first thing GCW employees see when they log into SharePoint.
In the next Arrow-Tip in our Using SharePoint to Communicate KPI Dashboards series, we’ll discuss where to keep and how to update metrics data. In the mean time, be on the look out for How to posts for some of the topics covered in this Arrow-Tip and happy selling!


Hi Misty,
Nice post. It’s good to see KPIs being published rather than defined and then kept quiet. The more public they are, the more embarrassed people are likely to be when they start slipping.
I’ve spent the last few years trying to convince clients that just coming up with a KPI without thought to why that number is important is more of a waste of time and resource than not having KPIs at all. I work in HR and too many companys are focussed on number of employees and attrition rates. Knowing the number of employees you have means nothing unless it’s linked to something that will change the performance outcomes of your business. And knowing attrition means nothing unless you’re willing to take steps to change it. Not forgetting that some industries count on high attrition for their workforce to remain fresh.
Anyway, thanks for the interesting post. I could talk about KPIs all night!
Cheers
Andy
Andy, thanks so much for your comment – Im in agreement with you, KPIs shoudl totally be published internally to help employees see daily how they are doing on the goals they are being evaluated against and as a whole.