Arrow-Tip #64 Housing Your SharePoint KPI Dashboard Data
In Arrow-Tip #61 Publishing KPI Metrics in Microsoft Excel we discussed compiling data in and Excel spreadsheet and then publishing the data on SharePoint from there. In this post we will discuss the places on SharePoint we house data that feeds the Excel Spreadsheet.
First of all, we created a special document folder to house the Dashboard spreadsheet itself, but most of the data feeding that spreadsheet comes from other places on SharePoint. GCW uses several SharePoint lists to house data and we thought about pulling data directly from those lists, but in the end eliminated that solution because it would require programming. We actually used the same reasoning for going with an Excel spreadsheet to summarize the data rather than just pull data directly into a shared web part. If you have access to SharePoint development resources in your organization, you might want to take that programmatic route or you can post a project on Scriptlance, Elance, or Guru and use external development resources. If you want to keep things simple, using spreadsheets stored on SharePoint and linked together works just fine.
Inspection Logs
For safety inspection data, we used simple inspection log spreadsheets stored in folders called “Daily Shop Inspections” and “Weekly Pop Safety Inspections” (see thumbnail below). Five days worth of data (one work week) is input into each workbook on its own worksheet and we maintain a form in a Forms folder that is downloaded and updated each week then saved into the Daily Shop Inspections folder. We use a naming convention for each workbook so that when we’re updating the links in the Dashboard spreadsheet, we don’t have to actually go to the Daily Shop Inspection folder to get the file name. Instead we can just do a global replace for the workbook file reference.
![]()
The Production Schedule
On-time shipment data used in the Dashboard spreadsheet is pulled from the GCW Production Schedule spreadsheet housed in the Shared Documents area of SharePoint. This document is the most frequently used reference for day to day operations since it keeps the management team abreast of everything from man hours used to due dates and delays. GCW maintains the Production Schedule in quarterly files with a fresh worksheet for each week. That way snapshots for how well GCW is staying under estimated man hours per job as well as man hour backlogs are captured on a weekly basis. Maintaining these snapshots also means that Dashboard spreadsheet links to the data in the Production Schedule must be updated weekly as well, but this exercise can be done easily with the global replacement feature in Microsoft Excel.
Payroll Spreadsheet
Indirect man hours are calculated within the GCW Payroll Microsoft Excel workbook where man hours logged to each job are recorded on a daily basis and housed in weekly worksheets within an annual workbook document. Hidden rows perform calculations that are then referenced in the Dashboard spreadsheet. Again, a global update is required each week since a new payroll worksheet is created each week. It is very important that we copy the exact worksheet format (using the Worksheet Move or Copy command as opposed to cutting and pasting) so that all hidden columns and rows are captured and remain in the same location and can therefore be referenced in the Dashboard worksheet without having to completely recreate the links each week.
Quotation Log
Pipleine information is taken from the Quotation Log Microsoft Excel workbook also stored in the Shared Documents portion of SharePoint. We used both projected revenues and closed business to calculate the Pipeline KPI for the current year which are housed on two separate worksheets within the Quotation Log workbook.
Manual Updates
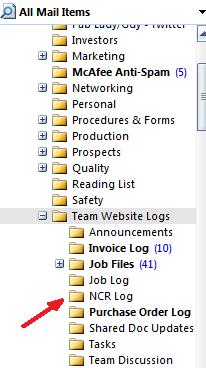
Average Labor Cost Per Hour and NDT Pass Rate are both derived from external system data (GCW Proprietary Accounting Software which does not export to Excel and GCW Quality Database) and therefore must be entered each month manually into the Dashboard spreadsheet. Fortunately this data only consists of a few figures (5 total for both metrics) so it does not take long to key in at all. NCRs are also input manually based on NCR log entries i.e. it is assumed that all jobs were accepted by the customer once they have been shipped if there are no entries in the NCR log. However, if an entry is made in the NCR log, alerts have been set up on SharePoint to alert team members responsible for updating the Dashboard Workbook so that NCR failures can be recorded manually. Alerts are set up to come directly to each employees Outlook Mailbox so they are easily spotted (see thumbnail below).
![]()
No doubt there is an easier way to record much of this information in SharePoint. If you know some of them, please share them with us in a comment. Still to come this week, excerpts from my interview with James Bond (yes, that is his real name) of Apptix regarding the MX Logic spam filter used in their hosted exchange services. In the mean time, happy hunting!
Excel tends to have limited functionality when it comes to KPIs. I prefer using the InetSoft platform. They provide interactive dashboards that are easy to develop and easy to use.
Thank you for your comment. Are you affiliated with Inetsoft or customer of theirs? Excel is limited, but I find very easy to get into since many people already know how to use it and it also works particularly well with SharePoint. Does the InetSoft plaftorm also integrate with SharePoint? We would love to hear more about how you chose the platform. Misty
Hi Misty,
I work for InetSoft. Our dashboard & reporting software can integrate with Sharepoint because it’s a Web-based BI application and any interactive dashboard or report can be accessed in an iFrame inside of Sharepoint. Just specify the URL to the InetSoft item you want to be able to use inside of Sharepoint.
We’ve aimed to make our software easy to use for people good at Excel. For instance the design workspace is an Excel-like grid, and all the same calculation functions you are used to using Excel are available in our software. We offer a free version that people can try out called Style Scope Free Edition, as well as commercial versions which have more security and data access options.
Thanks for the comment and information! Will InetSoft work for a hosted SharePoint solution? If so, I will check it out!
Who is hosting it? Is your company hosting it for your clients? If so, it’s a straightforward “yes.”
But if you are client of company hosting Sharepoint for you, then it’s possible but you have to realize that you would still have to install the InetSoft software in your own network. And then you could embed the dashboards and reports in the hosted Sharepoint environment since it would call the URLs in your network where the InetSoft software is running. A Web server also needs to be running on the machine where the InetSoft software is installed.
Thanks for your follow-up! My client uses a hosted SharePoint account – Apptix is the host. They actually use SharePoint instead of a server (this is a small company with only 7 exchange/sharepoint accounts) so doesn’t look like InetSoft is a potential solution for them. Would love to hear from some InetSoft clients though about how they are using your software. Thanks again! Misty
Thanks for tip good job
thank you for reading. Misty
thanks for sharing
my pleasure. thanks for your comment.