How to Reference a Web Page in a SharePoint Web Part
If you are not quite up to coding SharePoint web parts to generate their own tables and charts, you might consider creating the table or chart in Excel, saving the Excel file on SharePoint and then referencing a published web page from the Excel file in your web part instead. Here is how:
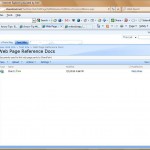
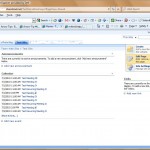
First upload your Excel generated web page into a document folder on SharePoint. Hint: if you are publishing a chart, make sure to adjust the size of the chart in Excel before you publish it to whatever size it will need to be in the SharePoint web part. In the left thumbnail below, I’ve created a folder just to hold documents that will be referenced in SharePoint web parts. Now, click on the file name and you should be redirected to the file contents (see right thumbnail below). Copy the address listed your browser to reference a few steps later.
Now navigate back to the page where you would like to insert your SharePoitn web part. In the example thumbnail below, I’m placing the new sharepoint on the home page of my SharePoint site. In the upper right hand portion of your site screen click the “Site Actions” button and then select “Edit Page” from the drop down menu (see left thumbnail below). Your SharePoint site should now be displayed in “edit mode”. Now, click on the ‘add a web part ” button at the top of the column where you would like to display your web page (see right thumbnail below).
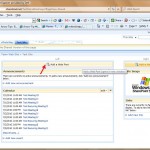
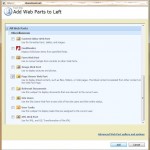
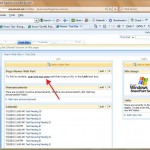
The “Add web parts” window will now open (see left thumbnail below). Scroll down to the “All web parts” group and check the “Page viewer web part” box. Then click the Add button the lower right hand corner of the window. A new web part will now appear on your SharePoint page (see right thumbnail below). Click the “open the tool pane” text (see arrow on right thumbnail below).
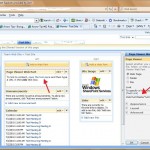
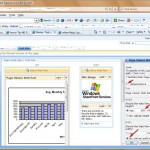
A tool pane will now open on the right for your page viewer web part (see left thumbnail below). Right below the “Link” label in the “To specify a link, type a URL or path field, paste the URL that you copied earlier when you viewed your web page from where it was saved on SharePoint. When you click the “test link” text, a window should open with your web page. You may need to adjust the size of your web part to fit your chart or table inside. To adjust the size of the web part, expand the “Appearance” category in the web part tool pane and then adjust the height and width pixes accordingly. Make sure to select the “yes” radio button for height or width and you can experiment with different sizes by clicking the Apply button on the bottom right hand corner of your tools pane.
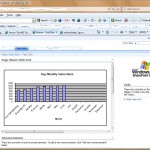
Keep in mind that your column width will automatically expand when you exit the tool pane since it is taking up some of the width on the SharePoint screen. When you are finished adjusting the height and width of your SharePoint part, click the OK button on the web part tool pane and then the Exit Edit Mode button on the upper right hand portion of your SharePoint page. Your chart should now be displayed on your SharePoint page (see thumbnail below).
Comments
No comments yet.


